
Why Catholic Education for Kids?
Why Catholic Education Shapes Tomorrow’s Leaders
Mission Statement

We offer an education that combines Catholic faith and teachings with academic excellence.
We partner with parents in the faith formation of their children.
We set high standards for student achievement and help them succeed.
We provide a balanced academic curriculum that integrates faith, culture and life.
We use technology effectively to enhance education.
We instill in students the value of service to others.
We emphasize moral development and self-discipline.
We prepare students to be productive citizens and future leaders.
We have a 99 percent high school graduation rate. 85% of our graduates go to college.
We cultivate a faculty and staff of people who are dedicated, caring and effective.
We provide a safe and welcoming environment for all.
We teach children respect of self and others.
NAEP (National Assessment of Educational Progress) 2024 Results for Catholic Schools
How Catholic Schools Performed in the Nation’s Report Card
Mathematics
Catholic School and National Public School Student Performance 1990–2024
In 2024, the average scale score for Catholic school students at grade 4 was higher than the scores in 1990, 1992, 1996, 2000, and 2003, but was not significantly different from the score in 2022 and the remaining years.
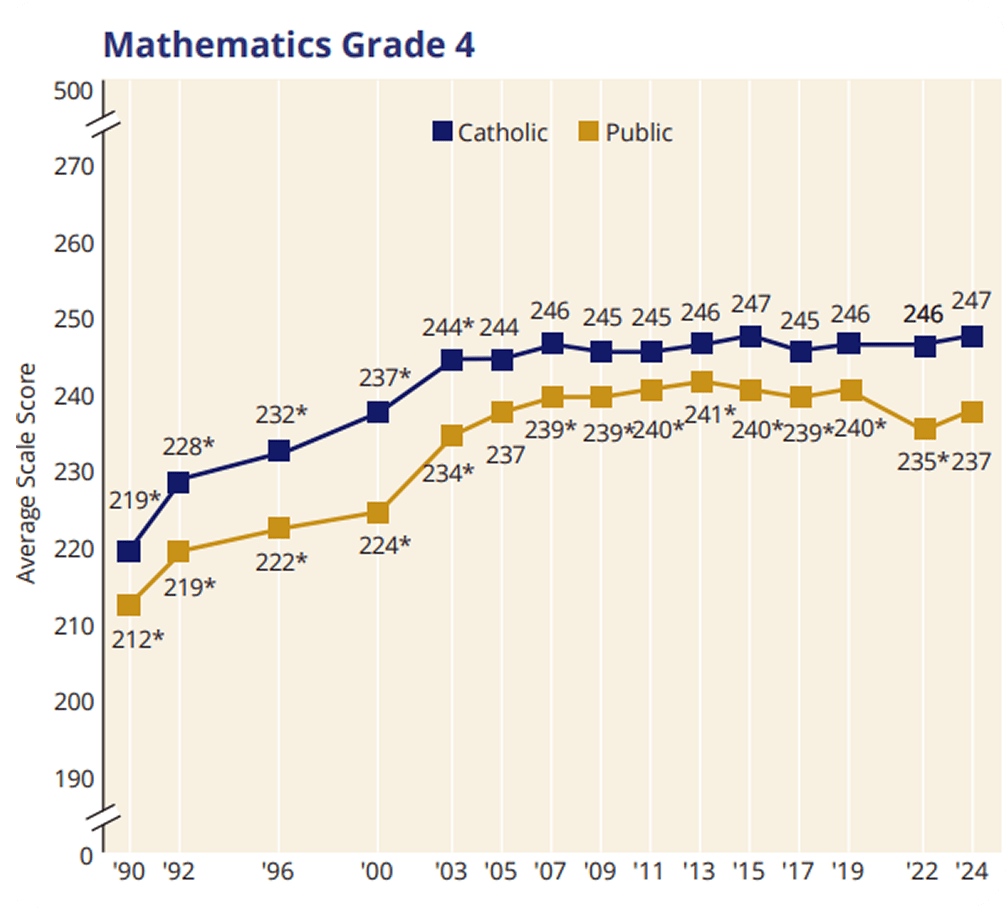
In 2024, the average scale score for Catholic school students at grade 8 was higher than the scores in 1990, 1992, 1996, and 2000, but was not significantly different from the score in 2022 or the other remaining years. Results are also shown for public schools to highlight change across time.

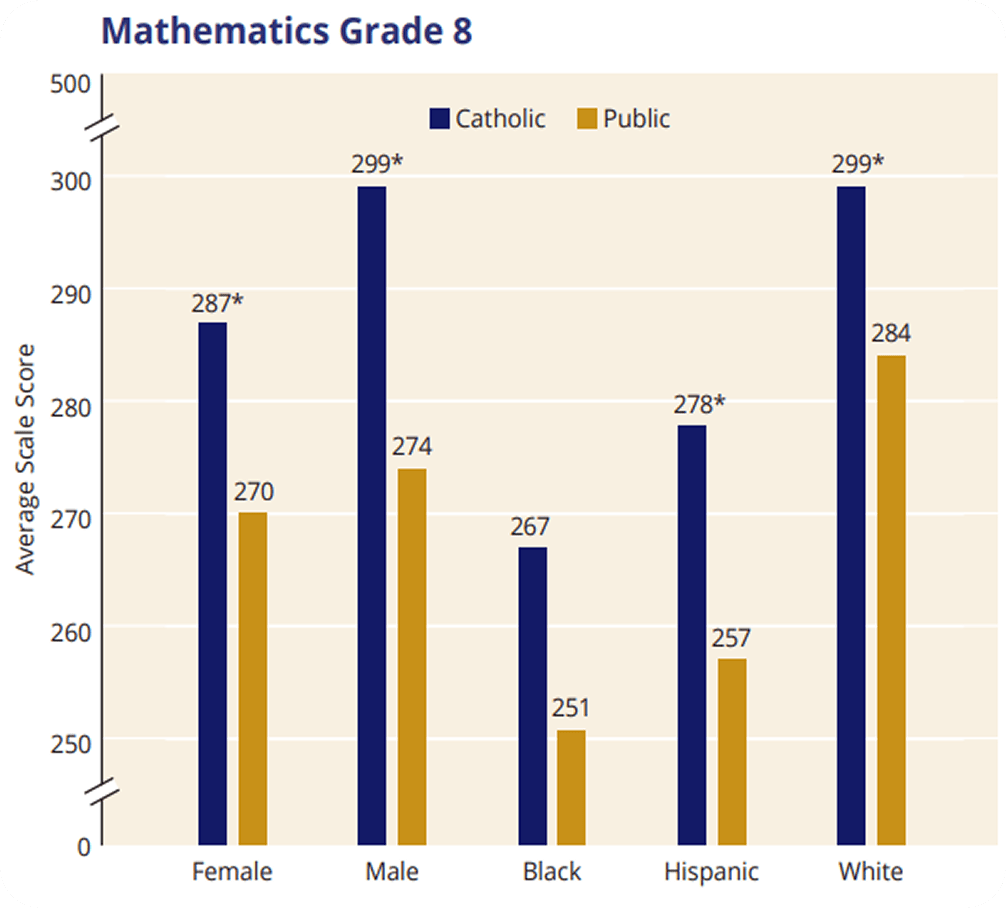
Mathematics 2024
Catholic School and National Public School Student Performance by Demographic Group
In 2024, female, male, Hispanic, and White students in Catholic schools scored higher on average than their counterparts in public schools in mathematics at grades 4 and 8. There were no significant differences on average in the performance of Black students in Catholic schools than those in public schools at grades 4 and 8.
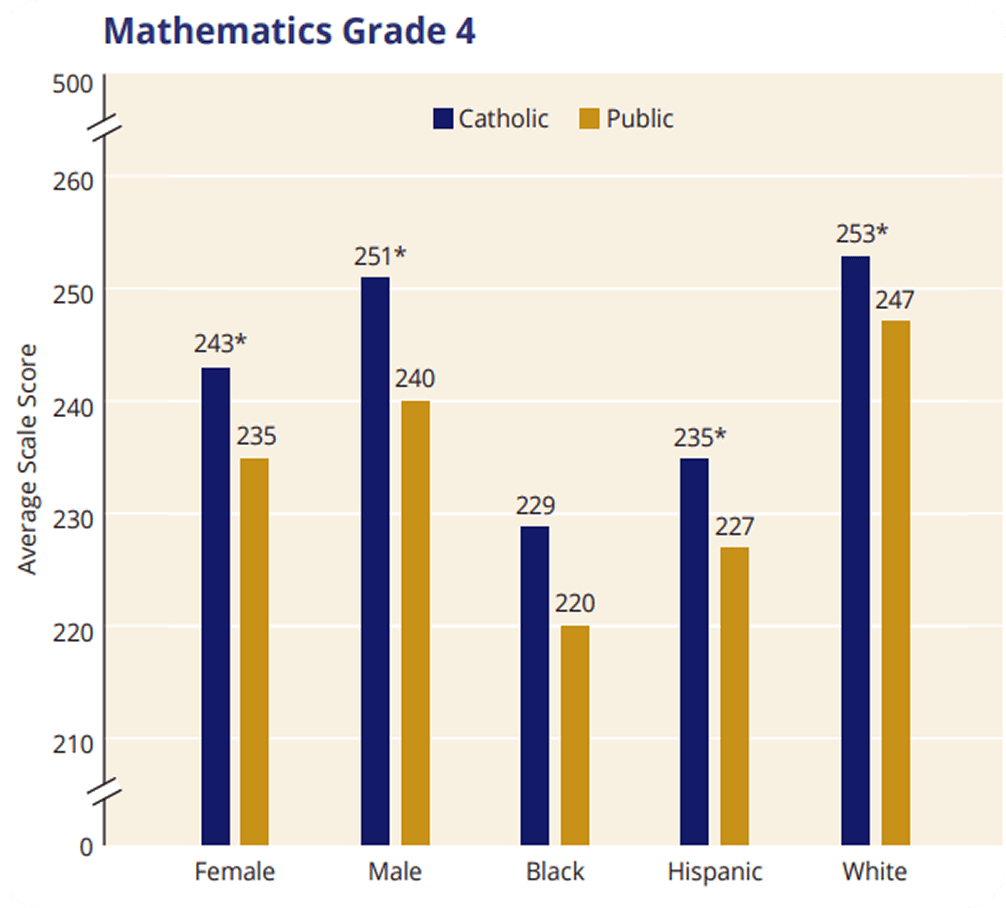
Results are not shown for American Indian/Alaska Native, Asian, Native Hawaiian/Pacific Islander, or Two or More Races because reporting standards were not met for these students in Catholic schools.
Reading
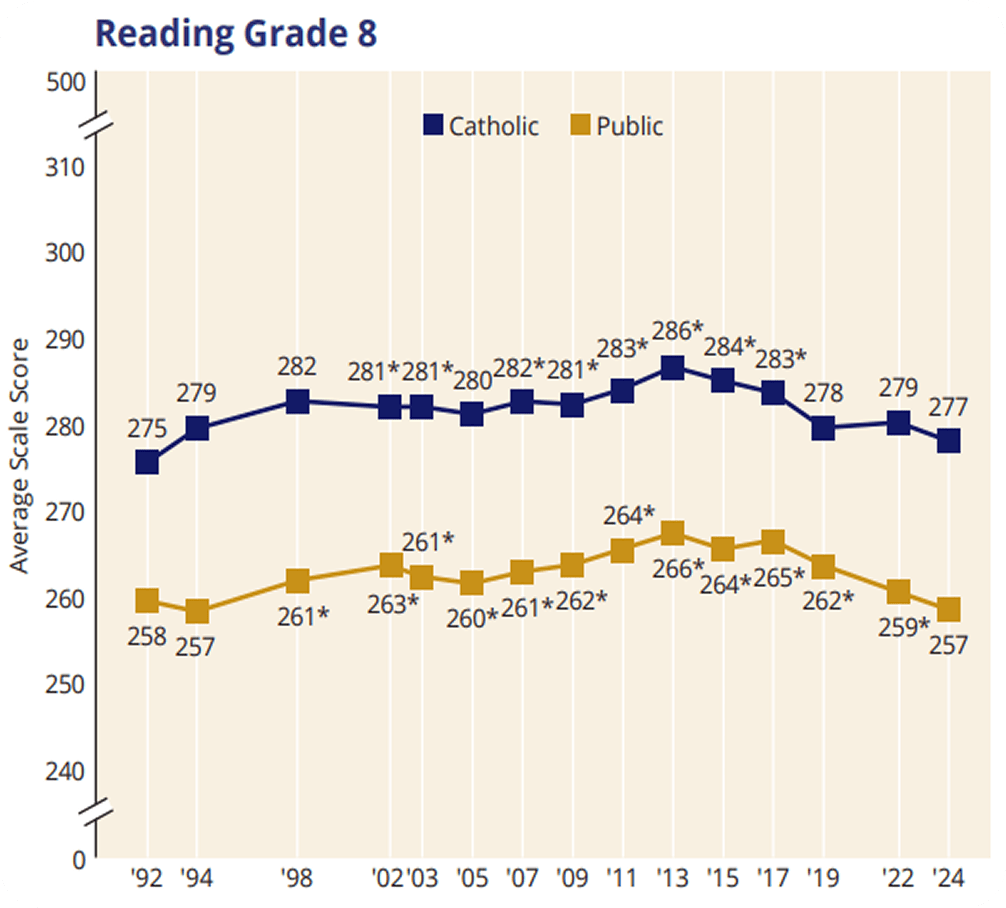
Catholic School and National Public School Student Performance 1992–2024
In 2024, the average scale score for Catholic school students at grade 4 was lower than the scores in 2002, 2003, 2005, 2009, 2011, 2013, 2015, 2017, and 2019, but not significantly different from the scores in 1992, 1994, 1998, 2000, 2007, or 2022.
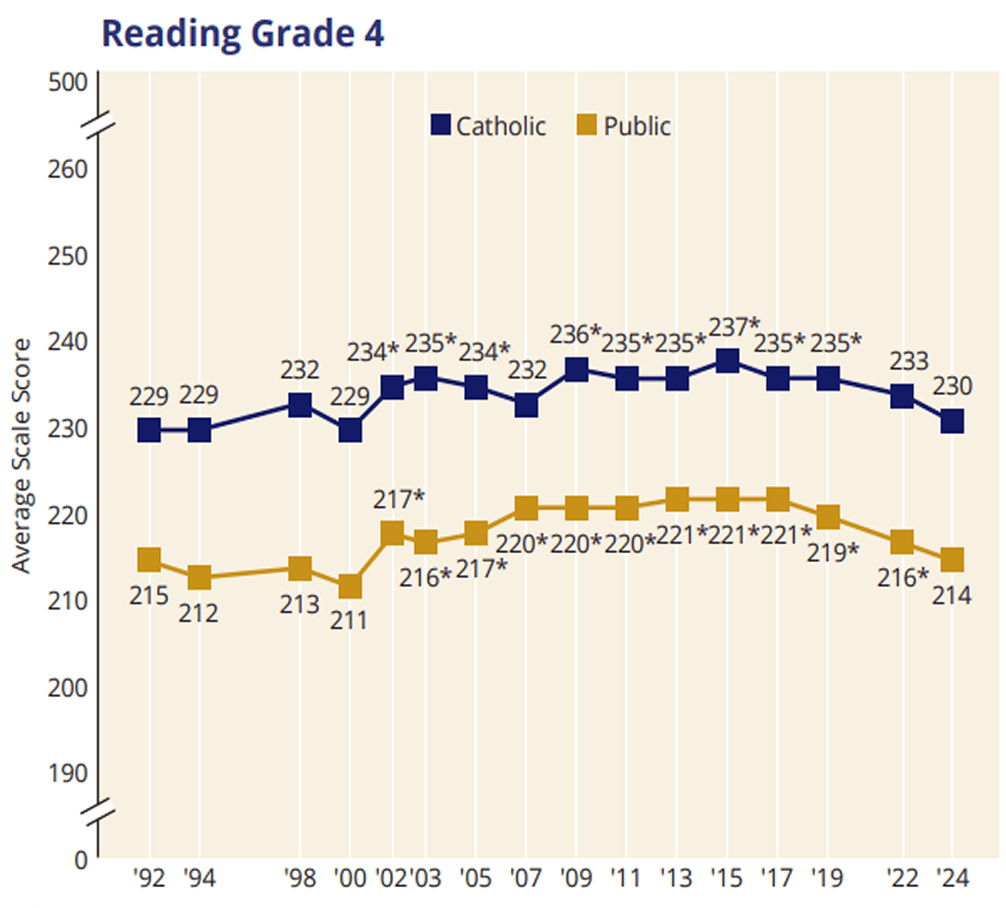
In 2024, the average scale score for Catholic school students at grade 8 was not significantly different from the scores in 1992, 1994, 1998, 2005, 2019, or 2022. However, the average scale score for Catholic school students in grade 8 in 2024 was lower than the scores in 2002, 2003, 2007, 2009, 2011, 2013, 2015, and 2017. Results are also shown for public schools to highlight change across time.
Reading 2024
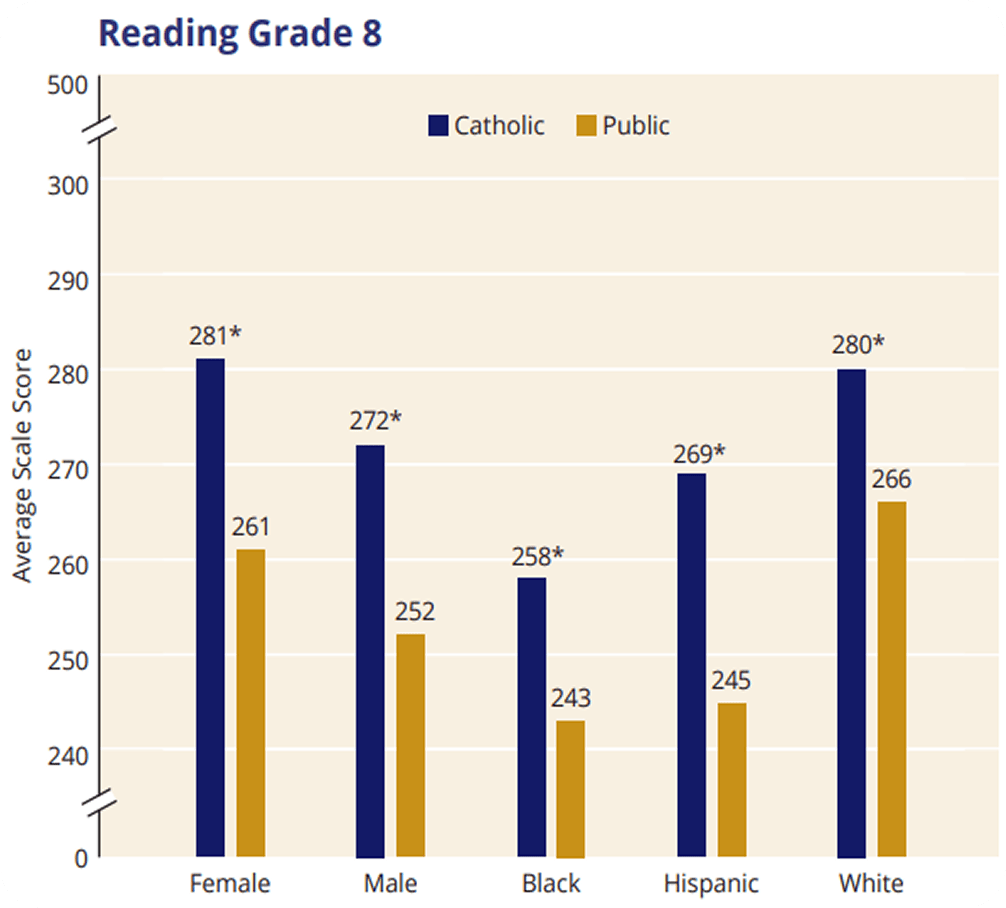
Catholic School and National Public School Student Performance by Demographic Group
In 2024, female, male, Black, Hispanic, and White students in Catholic schools scored higher on average in reading at grades 4 and 8 compared to their peers in public schools.
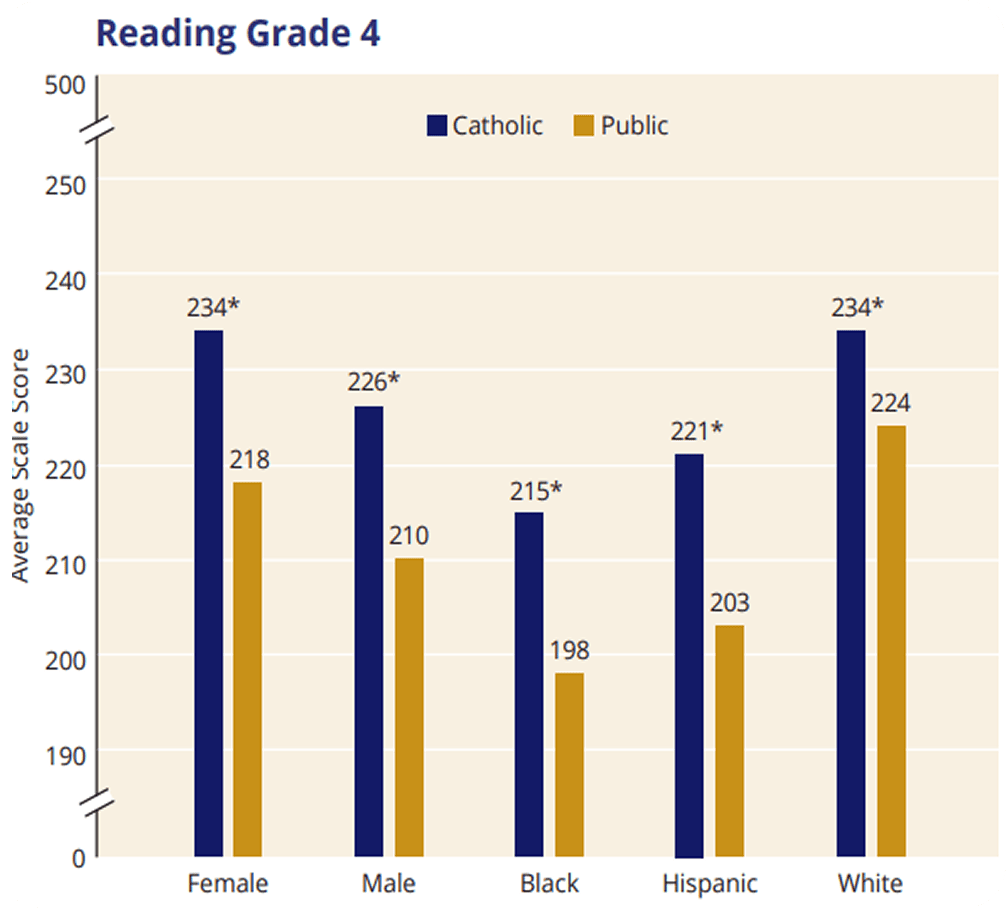
Results are not shown for American Indian/Alaska Native, Asian, Native Hawaiian/Pacific Islander, or Two or More Races because reporting standards were not met for these students in Catholic schools.
A Closer Look at a Contextual Variable
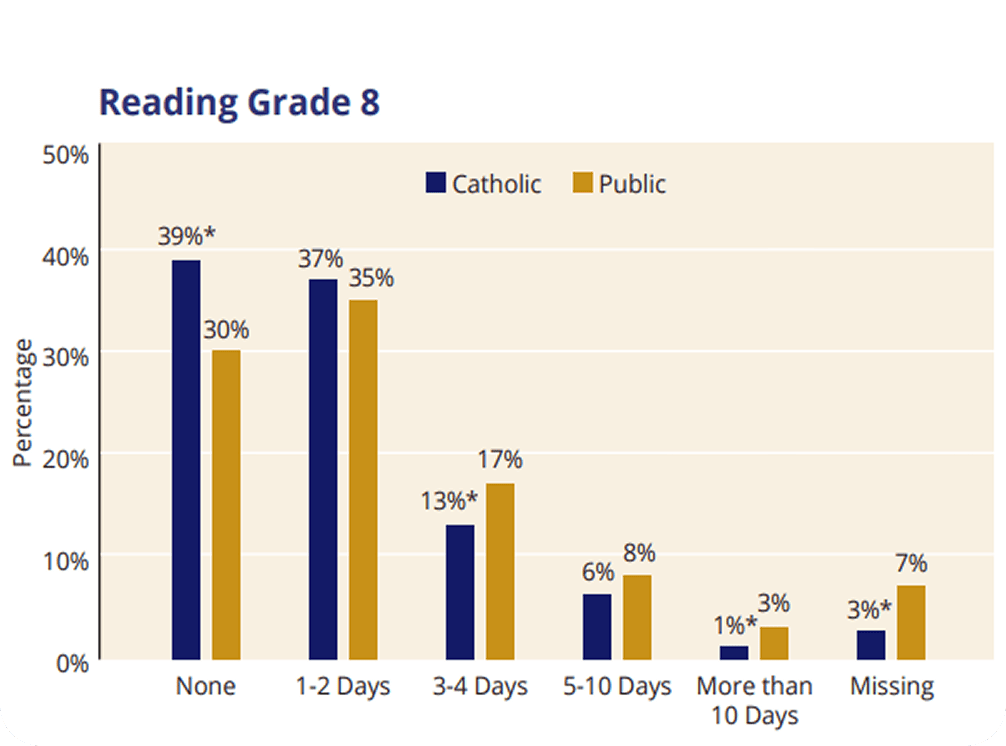
Number of Days Absent from School – Grade 8 Reading
In addition to assessing subject-area achievement, NAEP collects information from students, teachers, and school administrators that helps put student performance into context. This information includes a variety of factors that may influence achievement, including school climate and students’ opportunities to learn in and outside of the classroom. Students in eighth grade were asked to respond to the question, “How many days were you absent from school in the last month?”
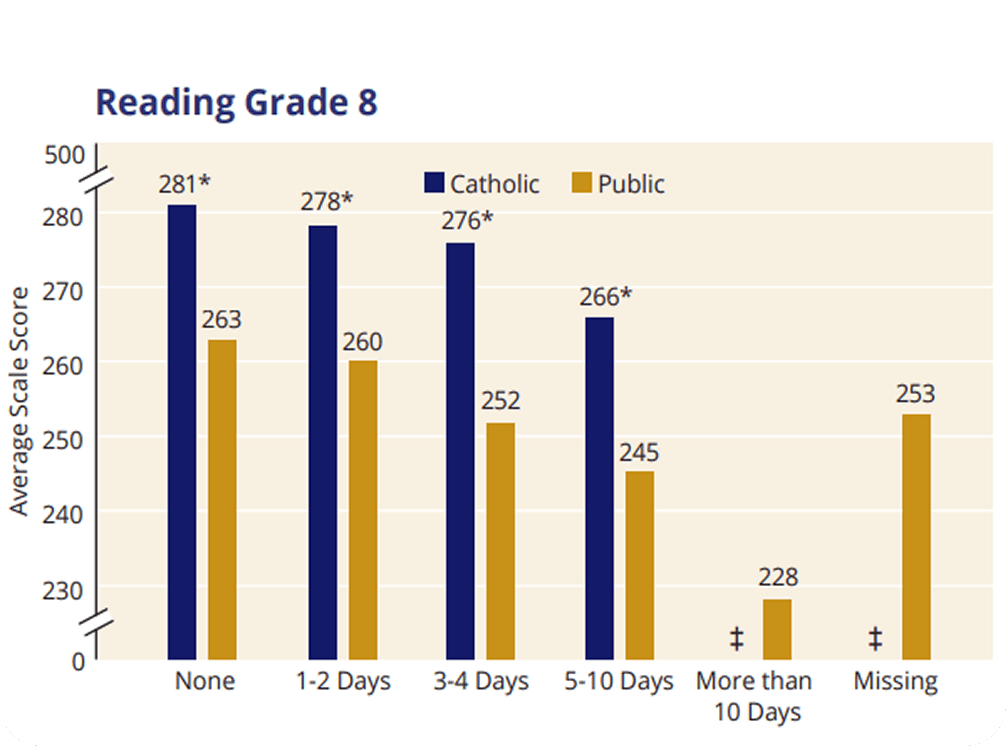
Students in Catholic schools who answered, None, 1-2 days, 3-4 days, or 5-10 days scored higher on average than public school students who responded the same way. In some of the response choices, the percentage of Catholic and public school students answered similarly; however, the percentage of Catholic school students who responded none (39%) was greater than that of students in public schools (30%). There were also fewer Catholic school students who reported being absent 3-4 days (13%) and more than 10 days (1%) compared to their peers in public schools (17% and 3%, respectively).

“Our love is not to be just words or mere talk, but something real and active.”
– 1 John: 3:18
Schedule a Tour
Reserve Your Spot At Our Next Open House

Contacts
